CoVID-19 Current Situdation Mathmatical Modeling Update
2021/01/02 Update
Prediction was carried out until December 10th using data of confirmed patients from October 1st to January 21th, 2021.
Policy Period
Social distancing level 1 10/1 ~ 11/16
Social distancing level 1.5 11/17 ~ 11/23
Social distancing level 2 11/24 ~ 12/7
Social distancing level 2.5 12/08 ~ (Ongoing)
Groups of 5 or more are prohibited. 12/23~(Ongoing,.)
Baseline : Maintaining the transmission rate of social distancing level 2.5(12/23~01/01)
Scenario 1: 10% / 20% / 30% reduction in transmission rate compared to the last week
Scenario 2: 20% / 30% / 40% reduction in transmission rate compared to the last week
Scenario 3: 10% / 20% / 30% increase in transmission rate compared to the last week
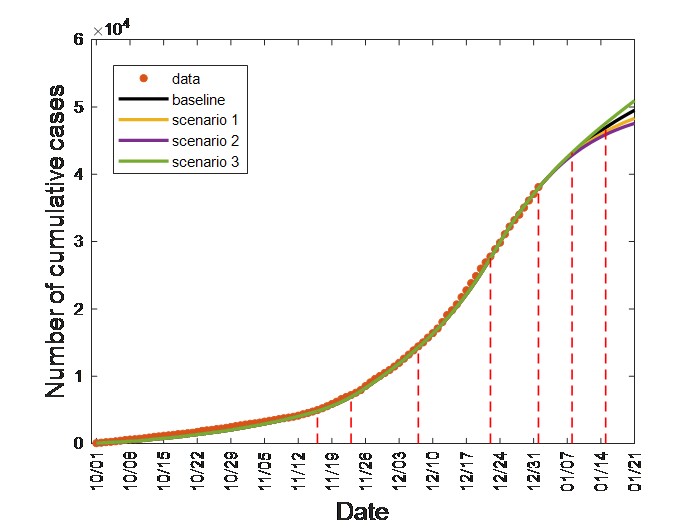
Data up to 01/01 were used, and are summarized in Table.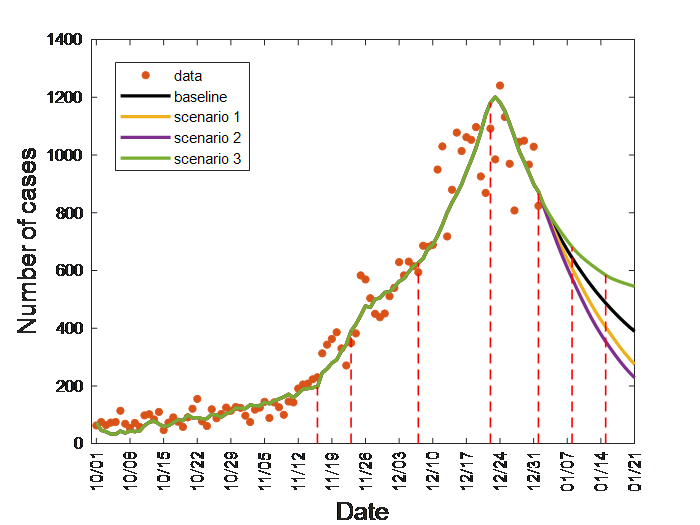
Data up to 01/01 were used, and are summarized in Table.
| Reduction rate of Transmission rate | Basic reproduction number | Estimated confirmed cases of 01/08 | Estimated confirmed cases of 01/15 | Estimated confirmed cases of 01/21 | |
| Baseline | 1.2663 | 619 | 462 | 364 | |
| Scenario1 | 10% / 20% / 30% | 0.6165 0.5480 0.4795 | 582. | 379 | 250 |
| Scenario2 | 20% / 30% / 40% | 0.5480 0.4795 0.4110 | 547 | 329 | 204 |
| Scenario3 | -10% / -20% / -30% | 0.7535 0.8220 0.8905 | 657 | 559 | 520 |
The policy seems to have an effect. However, since the number of confirmed cases during the holiday season is expected to appear next week, the possibility of an increase cannot be excluded.
2020/12/26 Update
Prediction was carried out until December 10th using data of confirmed patients from October 1st to January 14th, 2021.
Policy Period
Social distancing level 1 10/1 ~ 11/16
Social distancing level 1.5 11/17 ~ 11/23
Social distancing level 2 11/24 ~ 12/7
Social distancing level 2.5 12/08 ~ (Ongoing)
Groups of 5 or more are prohibited. 12/24~(Ongoing, However, it is not reflected this week because there is not enough data.)
Baseline : Maintaining the transmission rate of social distancing level 2.5(12/08~12/25)
Scenario 1: 10% / 20% / 30% reduction in transmission rate compared to the last week
Scenario 2: 20% / 30% / 40% reduction in transmission rate compared to the last week
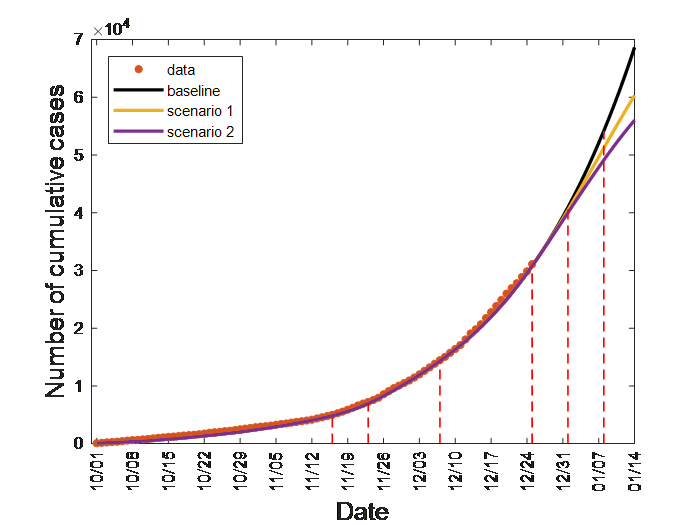
Data up to 12/25 were used, and are summarized in Table.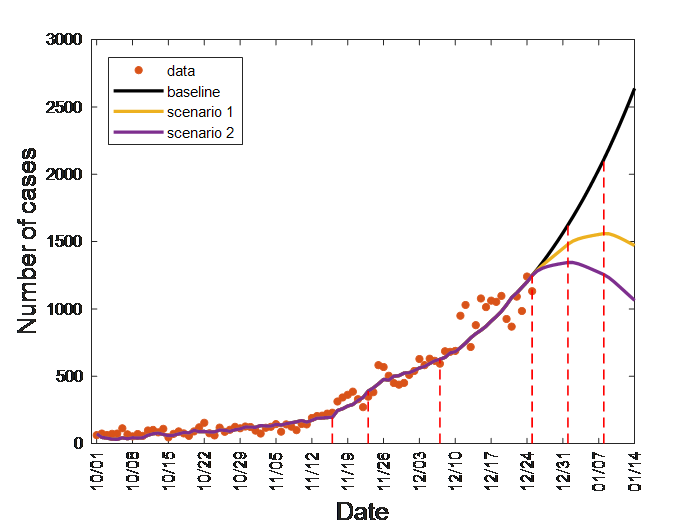
Data up to 12/25 were used, and are summarized in Table.
| Reduction rate of Transmission rate | Basic reproduction number | Estimated confirmed cases of 12/31 | Estimated confirmed cases of 01/07 | Estimated confirmed cases of 01/14 | |
| Baseline | 1.2663 | 1539 | 2009 | 2613 | |
| Scenario1 | 10% / 20% / 30% | 1.1396 / 1.0130 / 0.8864 | 1423 | 1528 | 1446 |
| Scenario2 | 20% / 30% / 40% | 1.0130 / 0.8864 / 0.7598 | 1314 | 1247 | 1039 |
The number of confirmed cases is expected to increase despite the ban on groups of 5 or more due to the Christmas holidays and year-end holidays. In the scenario, it is assumed that the effects of the quarantine policy appear after the end of the year.
2020/12/19 Update
Prediction was carried out until December 10th using data of confirmed patients from October 1st to December 25th.
Policy Period
Social distancing level 1 10/1 ~ 11/16
Social distancing level 1.5 11/17 ~ 11/23
Social distancing level 2 11/24 ~ 12/7
Social distancing level 2.5 12/08 ~ (Ongoing)
Baseline : Transmission rate of the last week (12/15~12/18, On weekends, the number of tests is low, so Sunday and Monday tend to be relatively low. Therefore, fitting from Tuesday except Monday)
Scenario 1: 20% reduction in transmission rate compared to the last week
Scenario 2: 40% reduction in transmission rate compared to the last week
Data up to 12/18 were used, and are summarized in Table.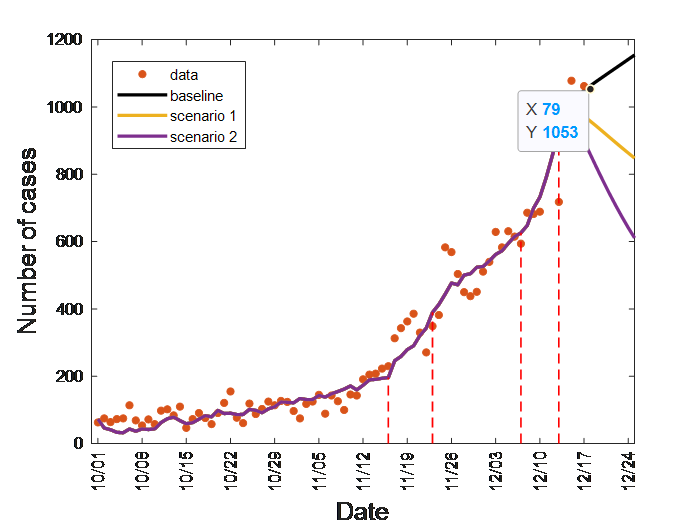
Data up to 12/18 were used, and are summarized in Table.
| Reduction rate of Transmission rate | Basic reproduction number | Estimated confirmed cases of 12/25 | |
| baseline | 0 | 1.0615 | 1130 |
| Scenario 1 | 20% | 0.8492 | 824 |
| Scenario 2 | 40% | 0.6369 | 586 |
The basic reproduction number over the past week has dropped to around 1. With the recent rapid increase in the number of confirmed cases in the metropolitan area, it is necessary to carefully observe whether the basic reproduction number is maintained or increased next week.
2020/12/12 Update
Prediction was carried out until December 10th using data of confirmed patients from October 1st to December 18th.
Policy Period
Social distancing level 1 10/1 ~ 11/16
Social distancing level 1.5 11/17 ~ 11/23
Social distancing level 2 11/24 ~ 12/7
Social distancing level 2.5 12/08 ~ (Ongoing)
Scenario
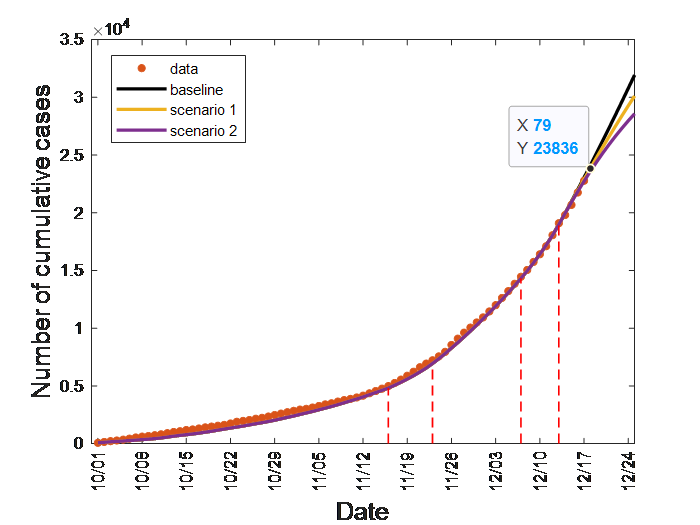
Baseline : Maintaining the transmission rate of social distancing level 2.5(12/8~12/11)
Scenario 1: Transmission rate decreased by 30% compared to social distancing level 2.5
Scenario 2: Transmission rate decreased by 50% compared to social distancing level 2.5
Scenario 3: Transmission rate is reduced by 70% compared to social distancing level 2.5
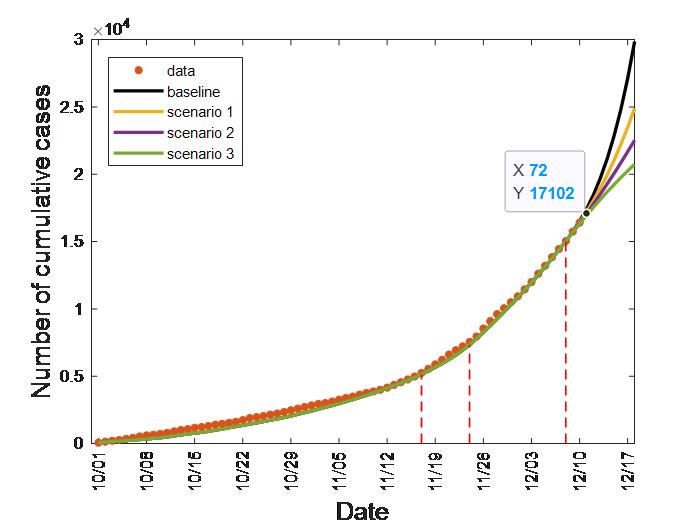
Figure 1a Data up to 12/11 were used, and are summarized in Table 1. 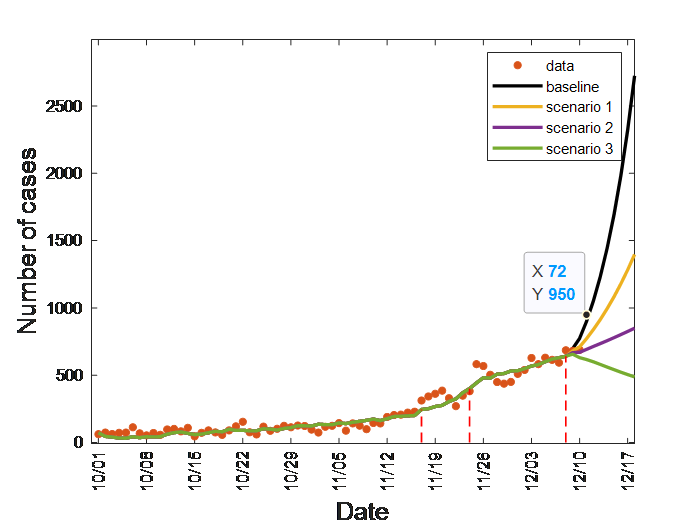
Figure 1b Data up to 12/11 were used, and are summarized in Table 1.
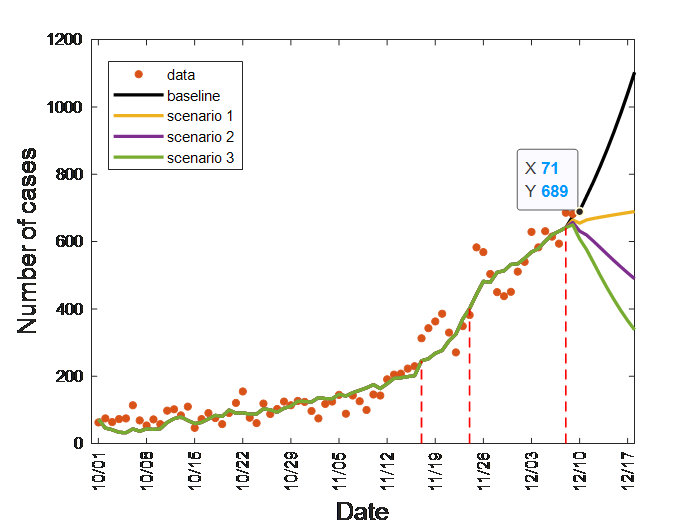
Figure 2a Data up to 12/10 were used, and are summarized in Table 2. 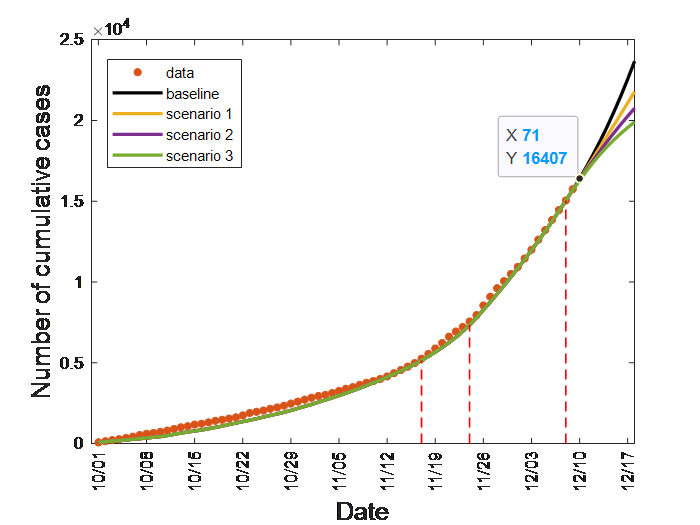
Figure 2b Data up to 12/10 were used, and are summarized in Table 2.
| Table 1 | Reduction rate of Transmission rate | Basic reproduction number | Estimated confirmed cases of 12/18 |
| baseline | 0 | 2.3688 | 2700 |
| Scenario 1 | 30% | 1.6581 | 1373 |
| Scenario 2 | 50% | 1.1844 | 825 |
| Scenario 3 | 70% | 0.7106 | 464 |
| Table 2 | Reduction rate of Transmission rate | Basic reproduction number | Estimated confirmed cases of 12/18 |
| baseline | 0 | 1.4266 | 1079 |
| Scenario 1 | 30% | 0.9966 | 665 |
| Scenario 2 | 50% | 0.7133 | 465 |
| Scenario 3 | 70% | 0.4280 | 314 |
As of 12/12 0 o’clock, it is not yet known whether 950 people are outliers or peaks, or whether doubling begins.
However, as can be seen from the scenarios in both cases, at the level of 30% reduction, R0>1 in Table 1 and almost 1 in Table 2, so it is judged that at least 50% reduction is necessary than the current contact rate.
2020/12/04 Update

Prediction was carried out until December 10th using data of confirmed patients from October 1st to December 3rd.
Scenario 1: Maintaining the transmission rate of social distancing level 1.5
Scenario 2: Transmission rate decreased by 20% compared to social distancing level 1.5
Scenario 3: Transmission rate is reduced by 40% compared to social distancing level 1.5
Currently, after level 1.5 (November 17 to November 23), level 2 (November 24 to) was implemented, which is a level of about 40% reduction in transmission rate. Since R0 decreased from 1.7995 to 1.1028 compared to level 1.5, there is some effect, but R0 is still greater than 1.
Description of further research
Spatial-temporal COVID-19 transmission dynamics : We focus on the COVID-19 outbreak of Seoul/Geonggi, Busan, and Daegu areas.
Investigate the recent transmission of COVID-19 that occurred in early February in Korea, and predict the future infection situation according to the quarantine policy of each city by fitting R0 and Transmission rate for the transmission situation in Seoul/Gyeonggi, Daegu, and Busan. And, by comparing the quarantine policies selected in each city, the most effective quarantine policy is selected, and the quarantine policy suitable for each stage of social distancing movement, such as social distancing, working at home, and online classes for students, rather than vaccine or regional closure The effect is analyzed by increasing and decreasing the value of R0 and Transmission rate through the SEIHR Model.
Denoising and demosaicking for image processing :
The subject of research is to restore images for image processing. We understand the characteristics of images, study existing algorithms, and develop algorithms to perform demosaic and denoise by mathematical methods. We are focusing on developing algorithms that are better than existing methods.
Mathematical modeling in epidemiology (Risk assessment of imported cases for COVID-19 in Korea) :
As the traffic between different countries increased, there were many cases of infectious diseases from other countries. We are studying infectious diseases imported through mathematical models. With the outbreak of the COVID-19, a mathematical model study is underway that takes into account foreign imported cases. Considering several scenarios, we emphasize the need for a policy on importation of infectious diseases in the future.
Mathematical modeling in biology and epidemiology : (Agent-based modeling and network modeling for MERS-CoV and COVID-19 in Korea)
Research the mathematical modeling in biology and epidemiology. As computing power is improved and the infectious diseases are going complicated, research of heterogeneity is more indeed. So, we use Agent based modeling method and Scale free network such that a network whose degree distribution follows a power law, at least asymptotically. Through these research, we suggest ways of distributing treatments more effectively or how to isolate them.